Veritas Recommendation System
What Buy, Reduce and Sell Mean
Our recommendation system has three tiers:
• Buy: Expected to generate a meaningful positive return or outperform our analyst's sector coverage over the next 12 months.
• Reduce: Expected to underperform our analyst's sector coverage over that time.
• Sell: Expected to generate a meaningful negative return.
While other firms may tell you to Buy or Hold 90% of the time, our recommendations can be roughly balanced between Buy or Reduce/Sell at any given time. Our track record proves this works.
Performance of our Buy and Sell total returns versus the S&P/TSX Composite in various time periods
Notes: Veritas performance from March 25, 1999, inception to June 30, 2026. Veritas Investment Research Corp. estimates. Performance for selected time periods (30, 60, 90, 180 and 360 days) averages the total return of individual calls relative to the S&P/TSX index over the period from their initiation date to the end of each time horizon. Only calls that extended through the full time horizon are included. Sell recommendations include Reduce recommendations when Reduces were added to our rating system in 2021. Returns greater than 1-year are presented as compound annual growth rates.
Comparing our Buys to Sells
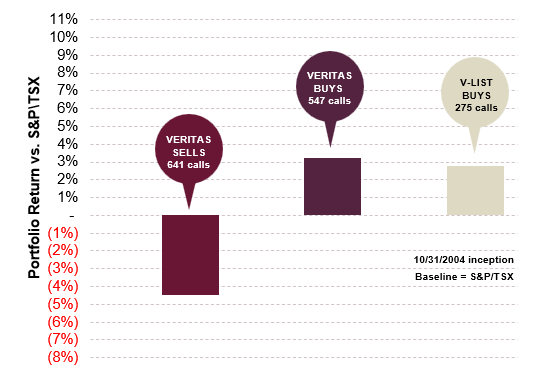
Long-Term Buy, Sell and V-List Performance
An equal-weighted portfolio of Veritas Sells/Reduces would have underperformed the S&P/TSX index by a compound annual growth rate of 450 basis points.
An equal-weighted portfolio of Veritas Buys would have outperformed the S&P/TSX index by a compound annual growth rate of 321 basis points.
Our model V-List portfolio has outperformed the S&P/TSX index by a compound annual growth rate of 278 basis points since inception (October 31, 2004).
Performance versus the S&P/TSX Composite March 25, 1999 to May 31, 2026
-450 bps
Veritas Sells/Reduces underperformed by 450 basis points CAGR since inception
+321 bps
Veritas Buys have outperformed by 321 basis points CAGR since inception
+278 bps
V-List Buys have outperformed by 278 basis points CAGR since inception
Notes: Returns are calculated using model portfolios that include all Veritas calls in each category (Buys/Sells/V-List). Veritas Buy and Sell returns reflect equal-weighted portfolios that are rebalanced each month and on dates when recommendations change. V-List portfolio returns reflect published weighting changes and recommendation dates, rebalanced monthly and on recommendation changes. Buy and Sell inception dates are March 25, 1999, and V-List inception date is October 31, 2004. Sell recommendations include Reduce recommendations when Reduces were added to our rating system in 2021. CAGR = Compound Annual Growth Rate Returns for each rating and the benchmark includes dividends. All our calls are backed by published research that is available to our clients. Contact us for further information. Source: Bloomberg data, Veritas Investment Research.
V-List Model Portfolio
What is the V-List?
The V-List is a concentrated portfolio of 12 to 25 companies recommended by our analysts as the best investment opportunities drawn from our firm's research.
Stocks are selected based on their liquidity, lower volatility, and potential for long-term capital appreciation. Bottom-up fundamental analysis and a strict review of accounting and disclosure practices identify companies with defensible competitive advantages and the ability to generate meaningful cash flow. The V-List is equal-weighted and rebalanced at the end of each month or based on a change in recommended holdings.
The V-List has outperformed the S&P/TSX Composite Index by 277 basis points (as of June 30, 2026, from inception on October 31, 2004).
V-List Model Portfolio vs S&P/TSX Index Since 2004 Inception
“Our level of due diligence is deeper. Our analysts cover fewer names, and they spend more time looking at the details associated with those names.”
– Anthony Scilipoti, President and CEO
“Our Top Pick companies generate more cash, so they can either directly return more cash to investors, or if they’re in growth industries, they can invest in growth.”
– Darryl McCoubrey, Member of the V-List Committee and Senior Analyst Energy & Pipelines
S-List Model Portfolio
What is the S-List?
The Veritas SELL List, or S-List, comprises all our SELL-recommended stocks by our analyst team. Using our valuation framework, our SELL-recommended stocks are expected to generate a negative return over the next 12 months.
We recommend SELLs based on their potential for downside risk, using bottom-up fundamental analysis. Our Veritas Quality Rating process scrutinizes accounting and disclosure practices to identify companies with eroding or low competitive advantages and weak cash flows.
Companies will be added to the list when our analyst team rates them as a SELL and removed when they are upgraded from SELL to either REDUCE or BUY. The number of names on our S-List is not limited, as the number can and will depend on market conditions.
Our SELL recommendations have underperformed the S&P/TSX Composite Index by a CAGR of 548 basis points (as of June, 2026, from inception March 25, 1999).
S-List Model Portfolio vs S&P/TSX Index Since 1999 Inception
Returns greater than 1 year are presented as compound annual growth rates. *S-List inception March 25, 1999.